Our Historical Performance
REAL WORLD RESULTS, NO SIMULATED BACKTESTING
PERFORMANCE
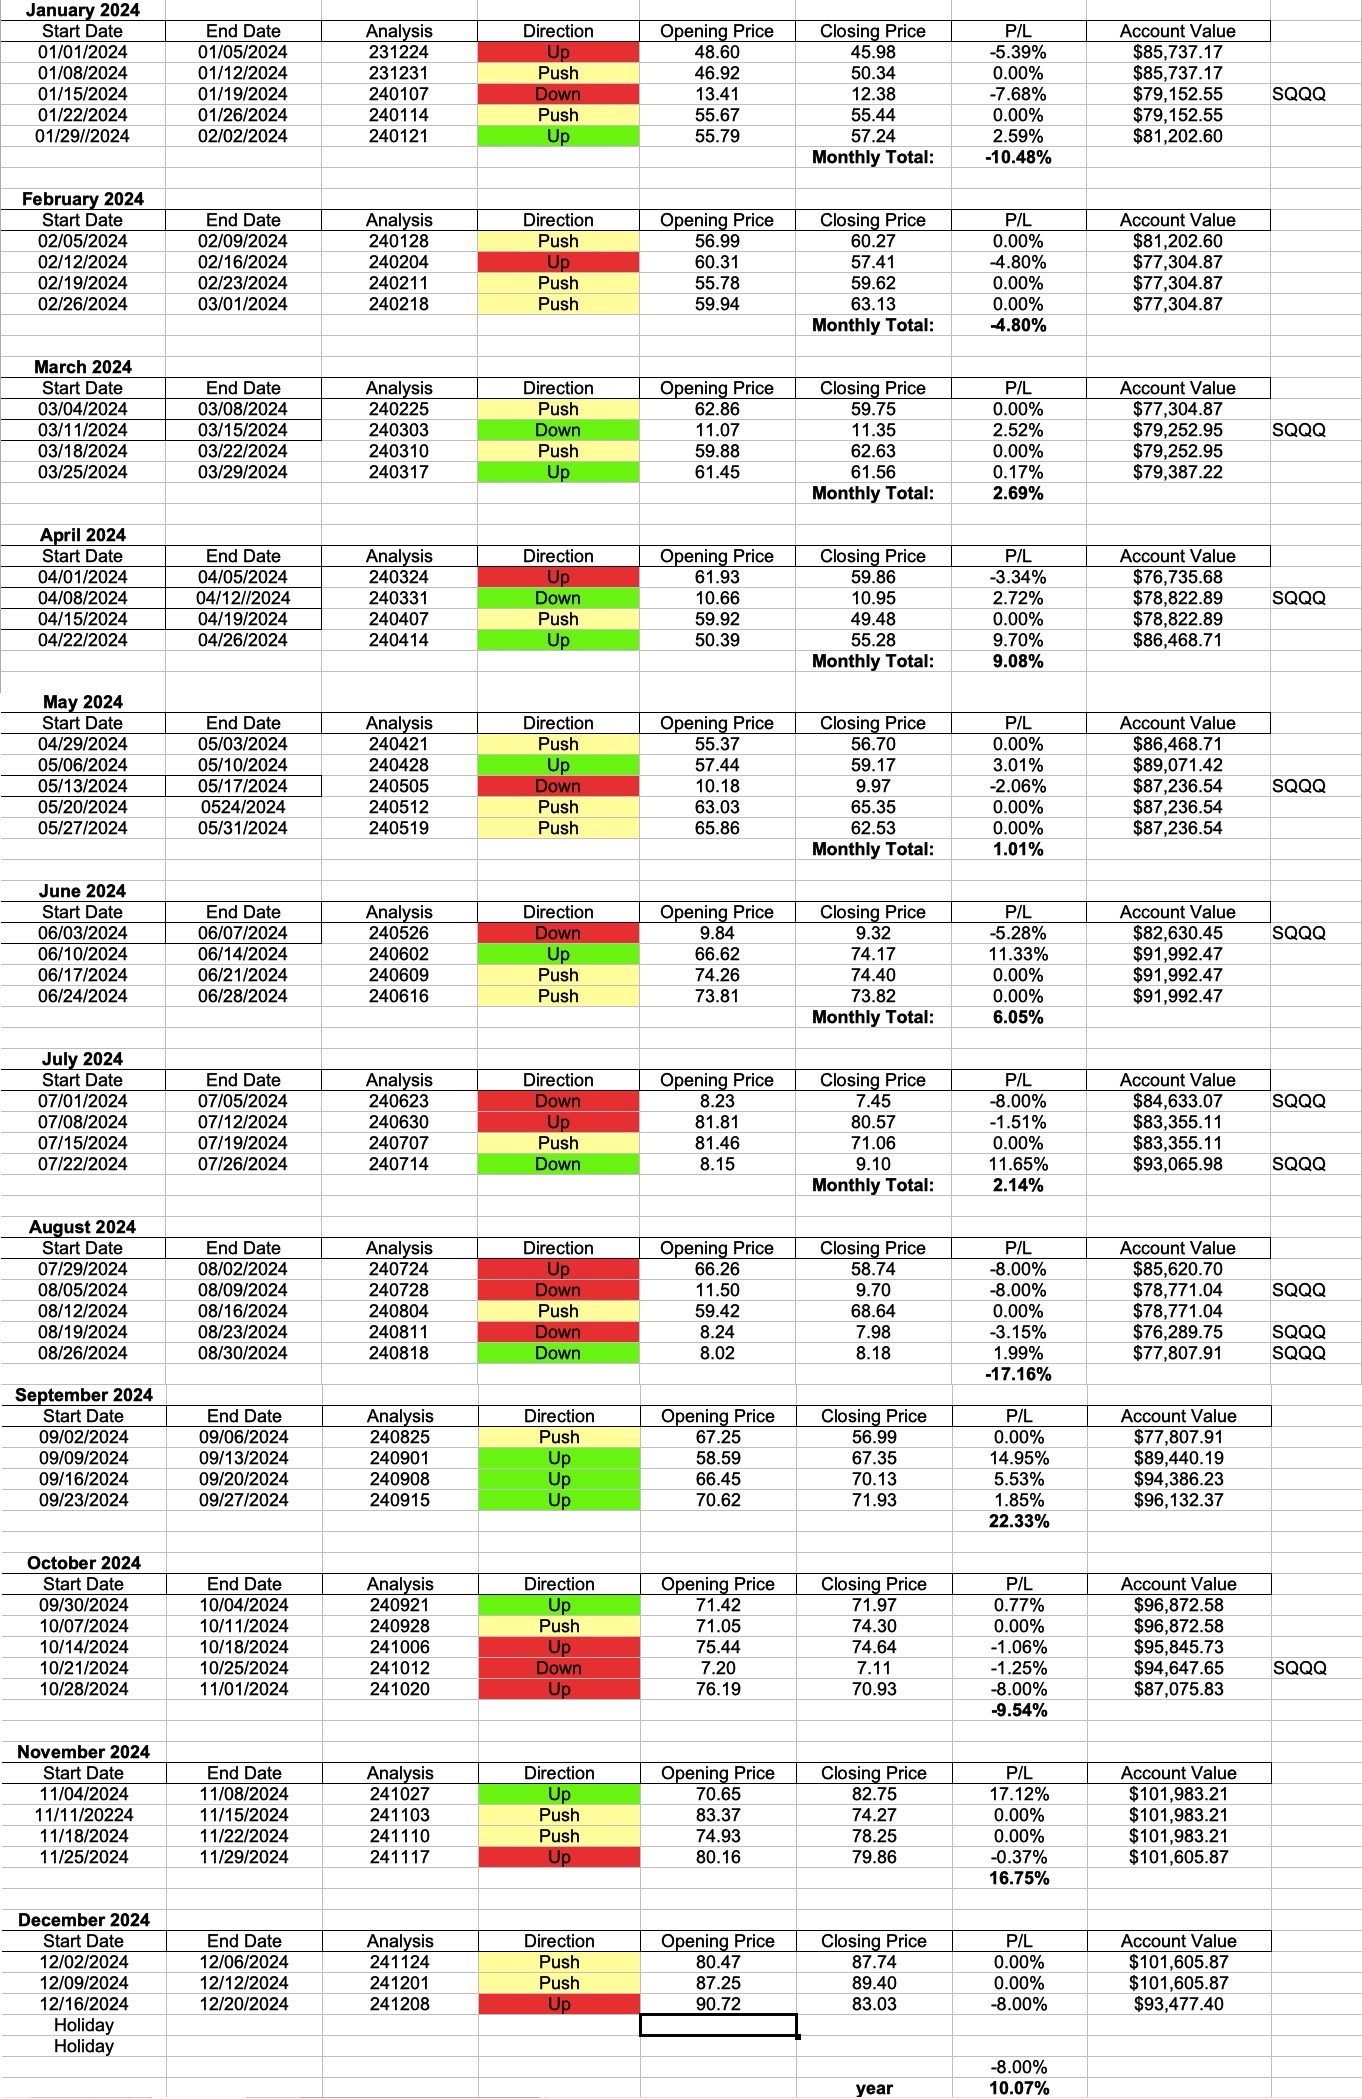
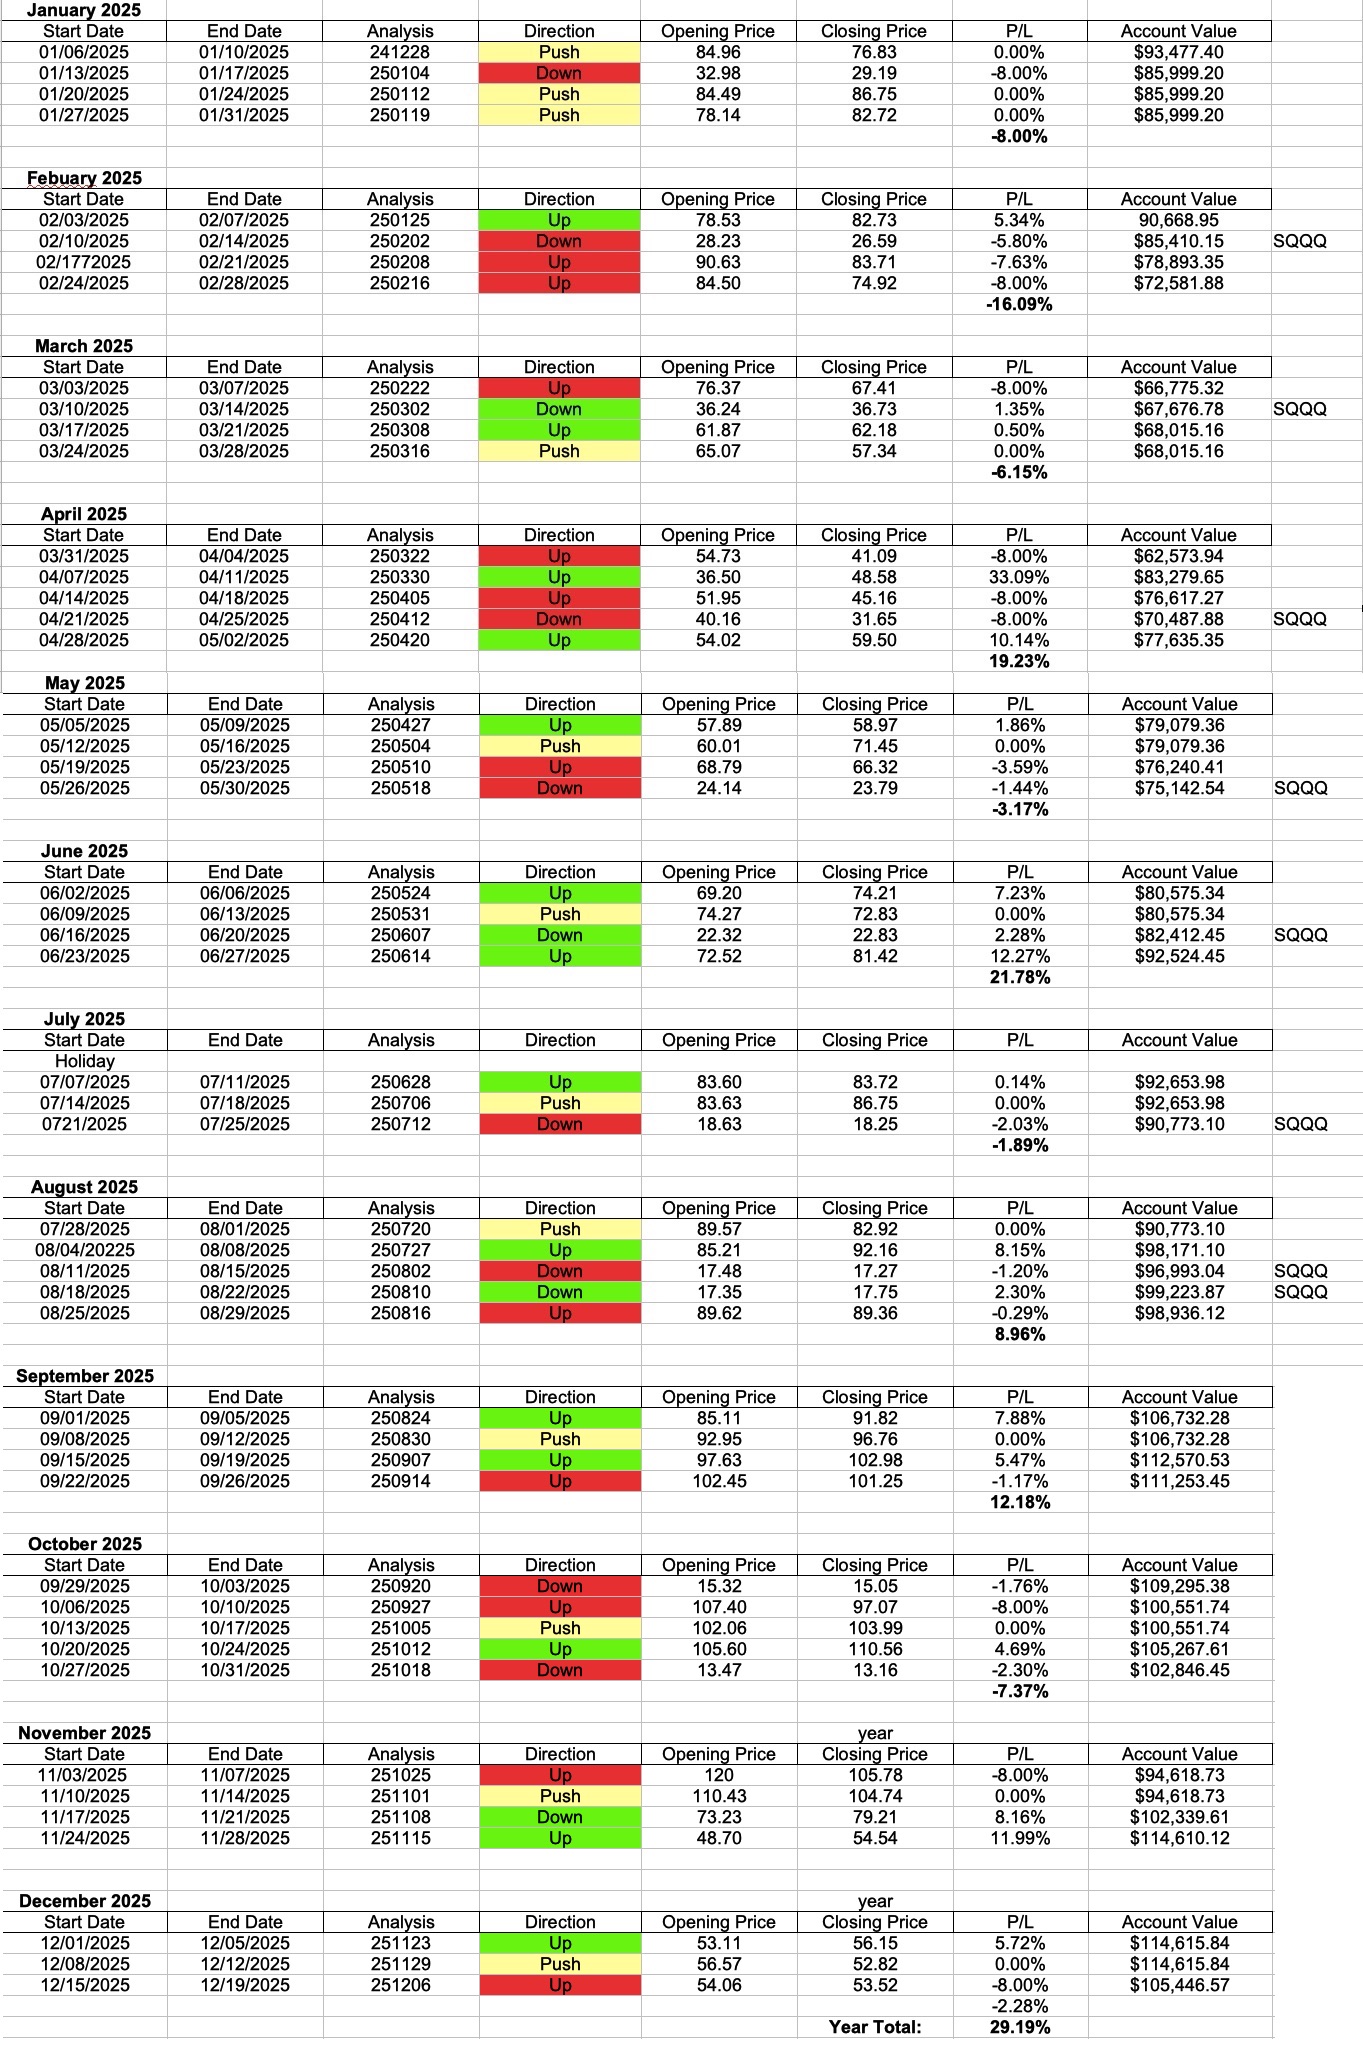
The following chart represents our performance for our weekly calls on the NASDAQ-100 QQQs from October 2020 to September 30, 2025.

| Historical Data |
|---|
| Click on an image below to enlarge
A note about the Down/SQQQ open and close prices in the images below. |
| 2020
|
2021
|
2022
|
2023
|
2024
|
|---|---|---|---|---|
| 2025
|
|
|
|
|


|
|
|
|
|---|